This is following on from my first blog on Victorian Crime Stats here: http://n6a.135.myftpupload.com/victorian-crimestats-analytics-in-power-bi/
This report is designed as an investigative tool. To help the business user to understand anomalies and trends by local government area.
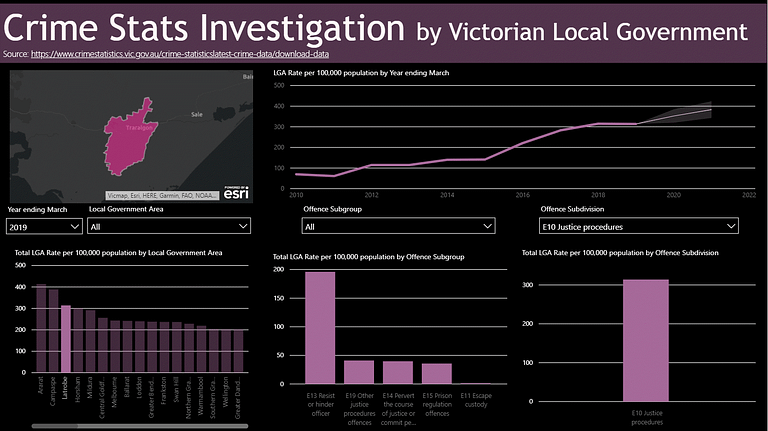
Check out the video below where I am looking at Latrobe and trying to understand the upward trend.
But why watch me do it when you can download it interact with it yourself. Feel free to grab the pbix file below.
Data from Crime Statistics Agency, 2019

Hope you have enjoyed this post. Are you are interested in how you can create something like this from scratch in an hour? Check out my Power BI Training for Government – One Day Intensive, which runs in Melbourne regulary.
Cheers,
One thought on “Victorian CrimeStats Analytics in Power BI – Part 2”
when you can download it interact with it yourself?
Comments are closed.