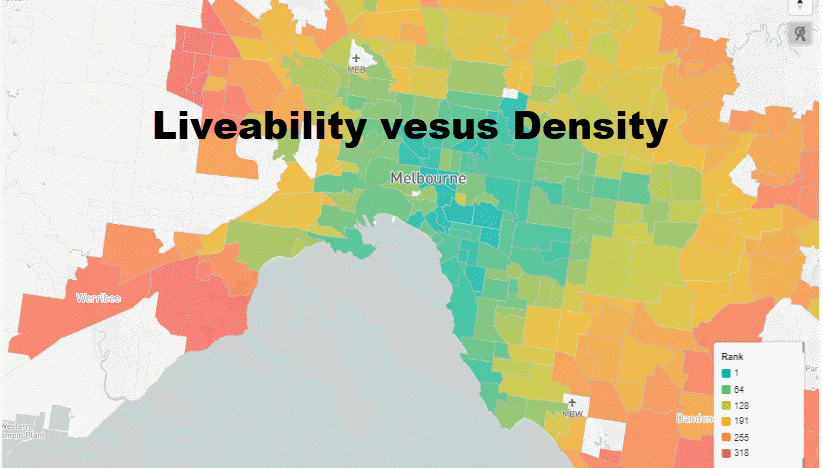
Liveability according to the Cambridge dictionary refers to “the degree to which a place is suitable or good for living in.” This seems straight forward but dig a little deeper and you will realise that this buzz word is harder to define than you think. What actually makes a city liveable seems to be under constant debate but in 2015 The Age and Tract Consulting had an attempt to rank 321 of Melbourne’s suburbs by their liveability. 15 indicators were used for the measurement. The only ones mentioned where access to public transport, open space, tree cover, schools and shops, and telecommunications. You can reference the article here: https://www.domain.com.au/news/melbournes-321-suburbs-ranked-for-liveability-20151106-gkq447/
Unfortunately, no data sources were provided so I decided to scrap the website and create an interactive map with Mapbox & Power BI of their rankings, to help me get a better understanding. Click the image below to interact with the map.
Looking at the map you can clearly see the pattern here. The further from the CBD you go the redder the map gets. I really wanted to know what the 15 indicators were though! I created a word cloud on the author’s explanation of their rankings which looked like this.
school 199 road congestion 184 shopping 177 open space 177 crime 170 access 167 culture + cultural 163 tree coverage 137 public facilities 137 cafes 133 telecommunications 60 coastline 47 topographic 41
I was able to possibly identify 13 of the 15 indicators. Schools were quoted the most as a reason for liveability. The coastline was also quoted while apparently having hills (topographic) is also an indicator.
One indicator that is not mentioned though is density. The higher the density of the suburb the higher the attained liveability ranking, which can be seen below. Possibly unintended but we can see a high correlation between the two. Click on the ”Switch to Density Scatterplot” button at the top right of the Power BI report to see the majority of the suburbs in a scatterplot of density (x-axis) versus liveability rank (y-axis).
Thanks,
Warren

